Graphical user interface
discopop_gui opens a desktop window around the project manager. It guides you from a first compile and execute script to measurements, hotspots, pattern detection, repair of generated patches and empirical autotuning. Each tab runs the matching DiscoPoP tool for you and shows its result. Everything the GUI does is also available on the command line and through the MCP server.
For a guided example, see the GUI walk-through.
Starting the GUI
Start the GUI in the root directory of your project:
cd <your project>
discopop_gui
| Command | Effect |
|---|---|
discopop_gui | Opens the GUI for the project in the current directory |
discopop_gui -p <dir> | Opens the GUI for the project in <dir> |
discopop_project_manager --gui | Same as discopop_gui |
discopop_gui accepts the arguments of discopop_project_manager, but only -p/--project and the logging options matter for the GUI. A .discopop directory is created in the project if it does not exist yet; you do not need --init.
The GUI needs tkinter (Debian/Ubuntu: python3-tk) and a display. Without a display ($DISPLAY and $WAYLAND_DISPLAY unset), the command prints
ERROR: this command opens a graphical window, but no display is available (neither $DISPLAY nor $WAYLAND_DISPLAY is set).
-> For non-interactive use, see: discopop_project_manager --help
and exits with code 1. On such a machine, use the project manager or the MCP server.
Up to DiscoPoP 5.0, the bare discopop command opened the GUI. It is now the command line project manager.
Window layout
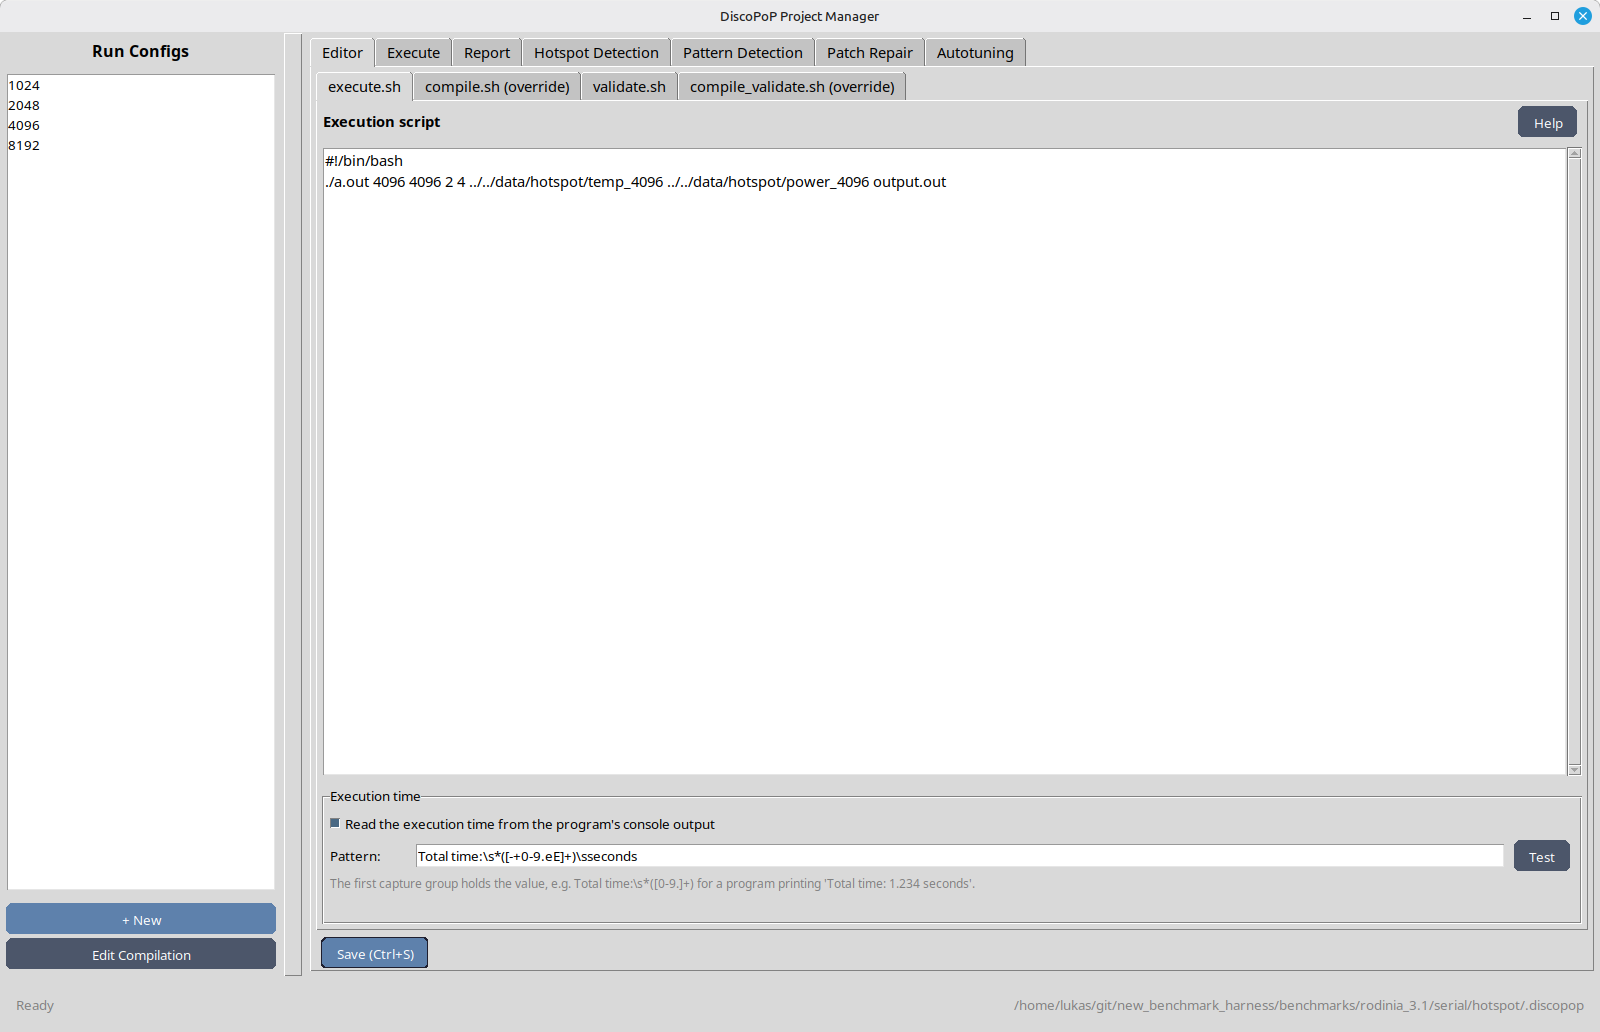
- Run Configs (left): the execution configurations of the project, i.e. the directories below
.discopop/project/configs/. Select one to work on it. A right click offers Copy, Rename and Delete. + New creates an empty configuration (you enter a name; itsexecute.shis a placeholder you have to edit). Edit Compilation opens the Compilation Editor. - Tabs (right), in workflow order: Editor, Execute, Report, Hotspot Detection, Pattern Detection, Patch Repair, Autotuning. Most tabs work on the selected configuration.
- Status bar (bottom): the current activity and the path of the
.discopopdirectory.
The tabs for later steps explain on mouse over which prerequisite is missing. For example, Pattern Detection needs profiling data and Autotuning needs pattern detection results.
Configuration assistant (wizard)
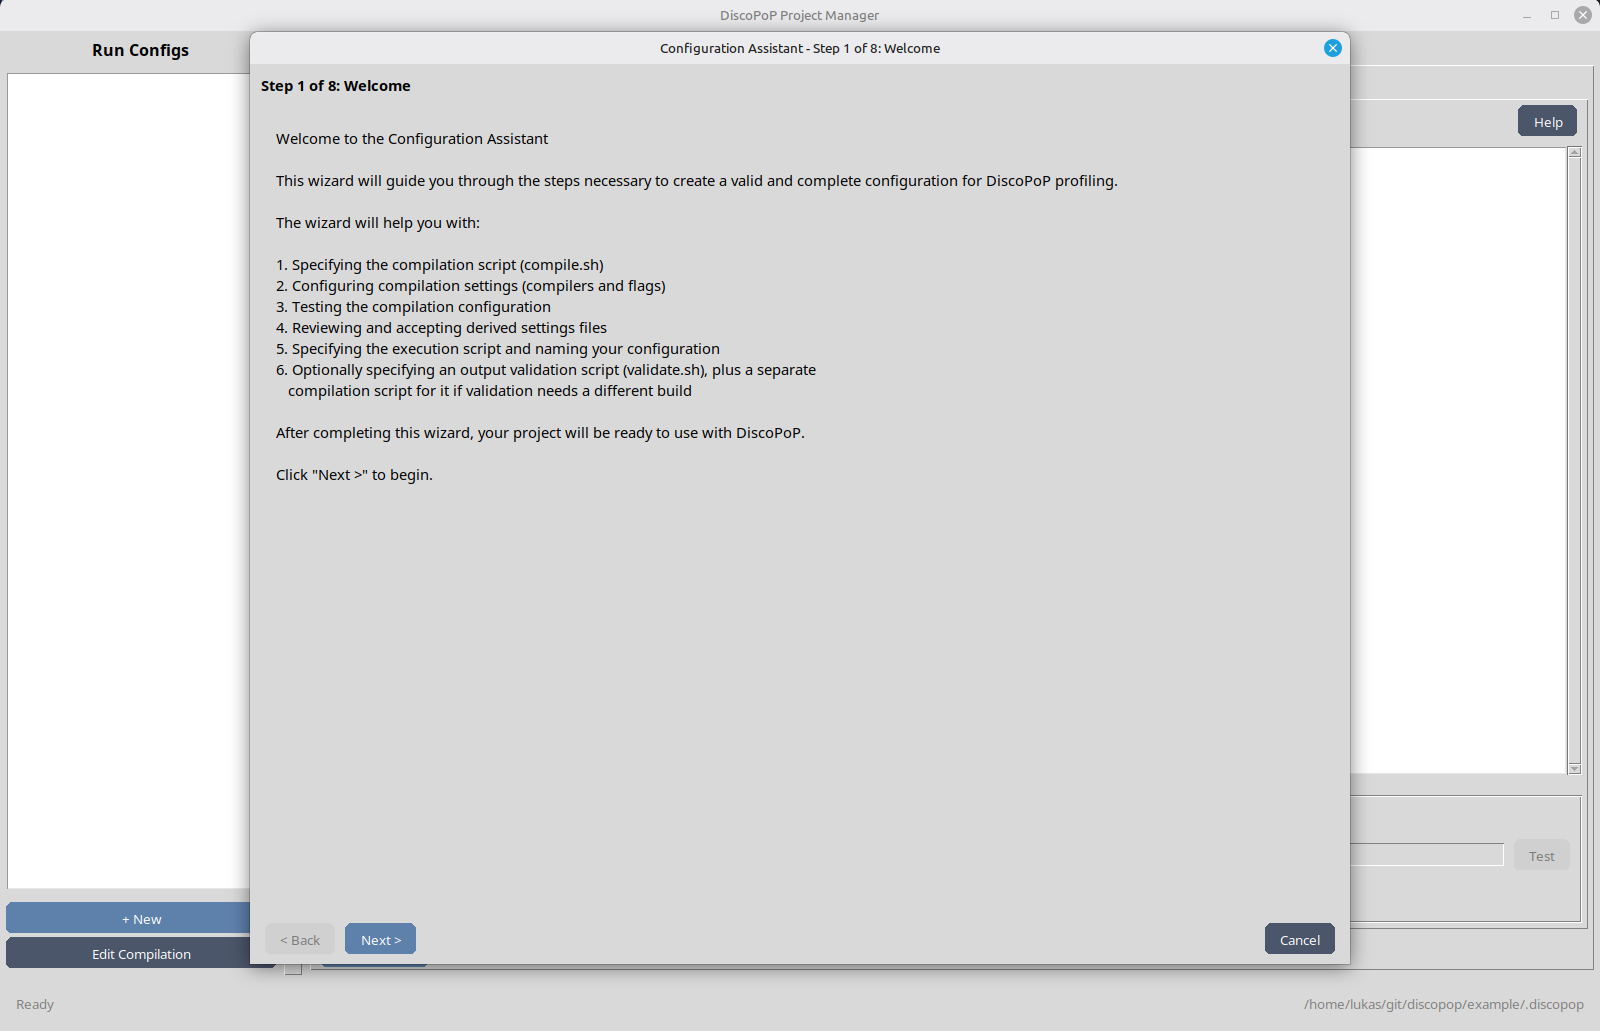
When the project has no usable configuration, the GUI opens the Configuration Assistant at start. It has eight steps:
- Welcome
- Write Permissions Check: the project is copied to a sibling directory for every run. Without write access to the parent directory, only in-place execution is possible.
- Compilation Script: the shared
compile.sh. Use$CC/$CXXand$CFLAGS/$CXXFLAGSfor all compile commands; the script must exit with0. The assistant asks for confirmation if it contains neither$CCnor$CXX. - Compilation Settings:
CC,CXX,CFLAGSandCXXFLAGSof the sequential build (seq_settings.json). - Test Compilation: Run Test Compilation builds the project with the script and settings and shows the status and the output.
- Derived Settings: shows
dp_settings.json,hd_settings.jsonandpar_settings.json, which are derived from the sequential settings. You can edit them before accepting. - Execution Script: the name of the configuration (default
default) and itsexecute.sh, a minimal run of the program. - Validation Script: optional
validate.shand, if validation needs another build,compile_validate.sh.
After Finish, the new configuration is selected and the Execute tab opens. See Project manager for the meaning of the scripts and settings.
Editor
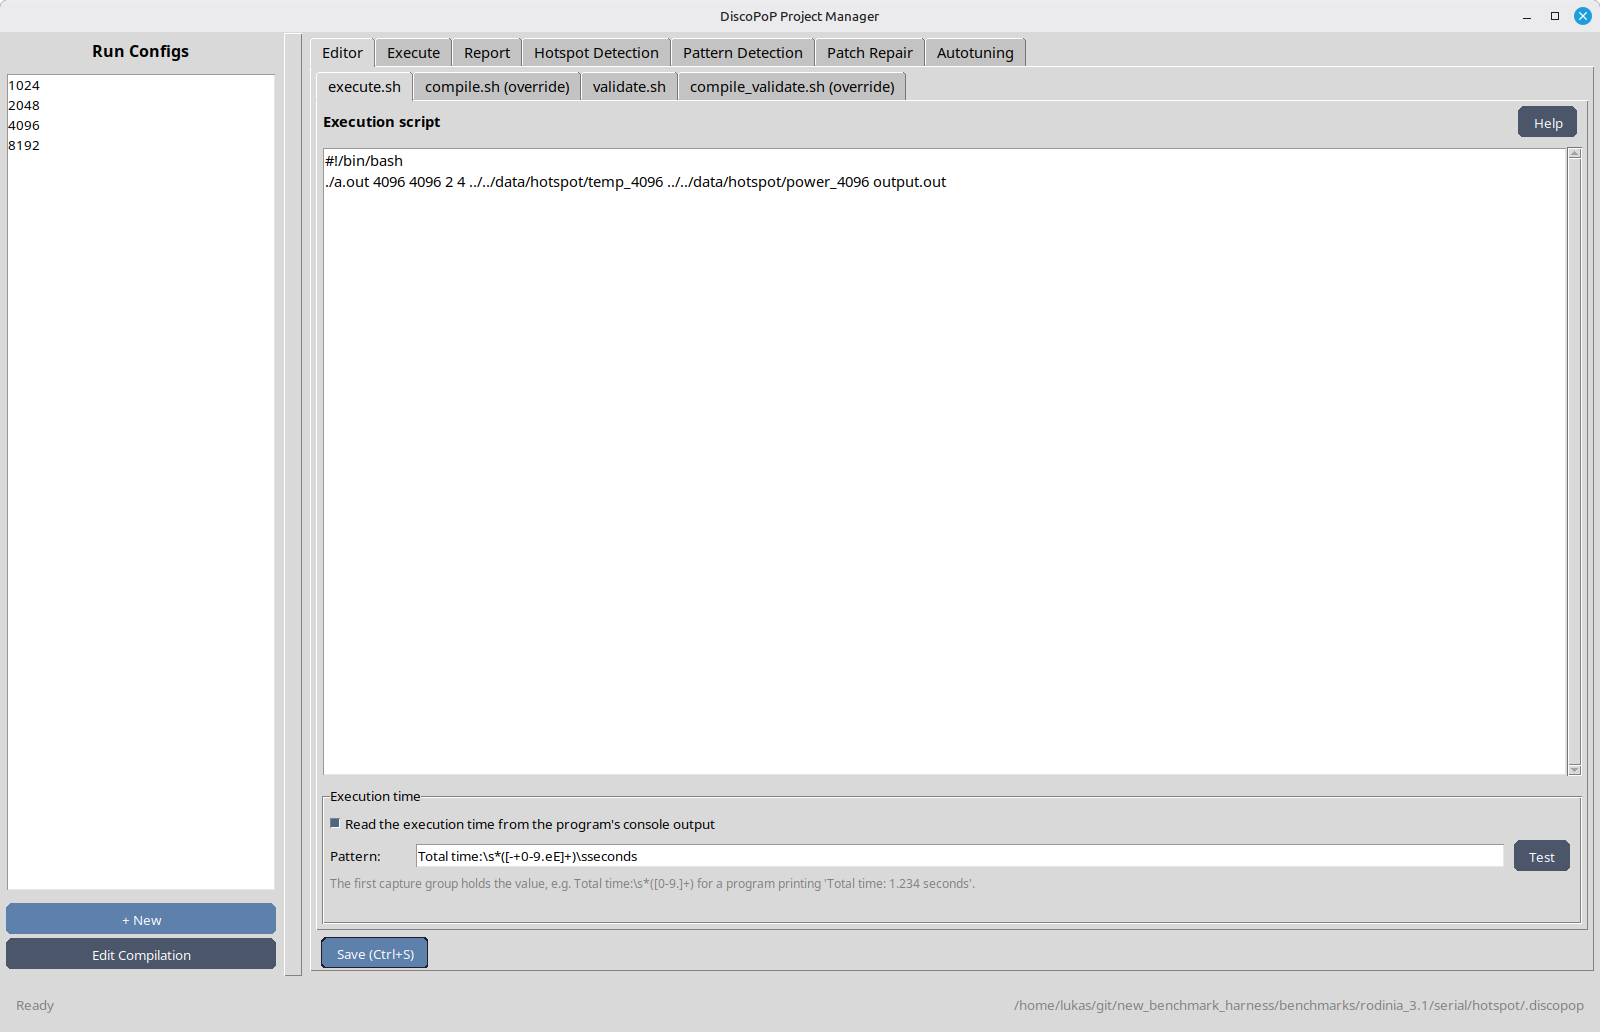
The Editor tab edits the scripts of the selected configuration. Save with Save (Ctrl+S). Every sub-tab has a Help button. The sub-tabs are:
| Sub-tab | Content |
|---|---|
execute.sh | The timed run of the program. Contains the Execution time setting (see below). |
compile.sh (override) | A build script used instead of the shared compile.sh for this configuration only. Add Override creates it, the button then removes it. |
validate.sh | Optional correctness check, run separately from execute.sh. Add validate.sh creates it. |
compile_validate.sh (override) | Optional build used for validate.sh only. |
The scripts are executed with the project root as working directory and with the environment variables described in Project manager.
Execution time
By default, the runtime of execute.sh is its wall clock time. Check Read the execution time from the program’s console output to measure the time the program prints itself instead. Pattern is a regular expression whose first capture group holds the value; the default searches for <DP_EXEC_TIME>1.234</DP_EXEC_TIME>. Test applies the pattern to the output of the last recorded run without executing anything. The setting is stored in execution_time.json next to execute.sh. See Measured runtime.
Compilation Editor
Edit Compilation (left) opens a separate window for the files shared by all configurations, each in its own tab: compile.sh, compile_validate.sh, seq_settings.json, dp_settings.json, hd_settings.json and par_settings.json.
- Save (Ctrl+S) writes the files.
- Test Compilation builds the project with the current script and settings and shows the result.
- Derive creates
dp_settings.json,hd_settings.jsonandpar_settings.jsonfromseq_settings.json:discopop_cc/discopop_cxxfordp,discopop_hotspot_cc/discopop_hotspot_cxxand-fopenmpforhd,-fopenmpforpar. - The shared
compile_validate.shis optional (Add / Remove).
The GUI does not derive the settings files again when it executes a configuration, so your edits of them are kept. The command line project manager overwrites them from seq_settings.json on every run.
Execute
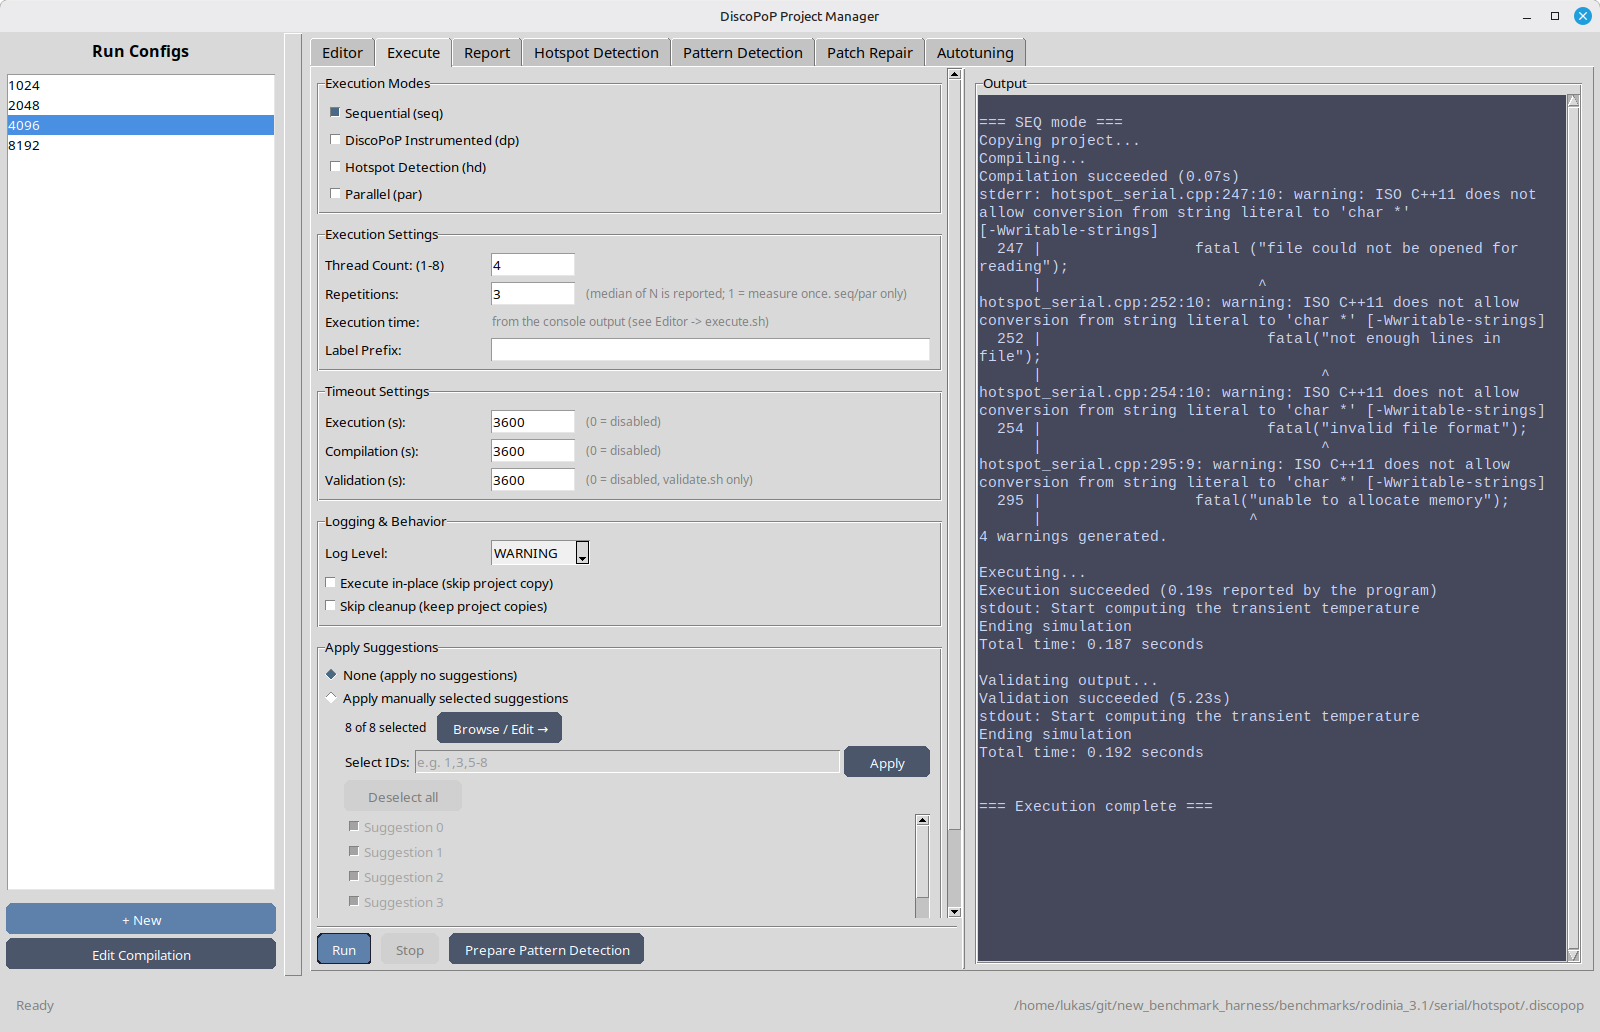
The Execute tab compiles and runs the selected configuration, as discopop_project_manager -x does, and records the measurements.
| Group | Setting |
|---|---|
| Execution Modes | seq (sequential), dp (DiscoPoP instrumented), hd (hotspot detection), par (parallel). A mode is available when its settings file, the compile script and execute.sh exist. |
| Execution Settings | Thread count (OMP_NUM_THREADS), repetitions (median of N, seq and par only), label prefix, the execution time setting of the Editor |
| Timeout Settings | Execution, compilation and validation timeouts in seconds (0 = disabled) |
| Logging & Behavior | Log level, Execute in-place (skip project copy), Skip cleanup (keep project copies) |
| Apply Suggestions | None, manually selected suggestions (Browse / Edit), or the suggestions selected by the autotuner |
Buttons: Run, Stop, and Prepare Pattern Detection. The latter runs the configuration in dp mode in place, which creates the profiling data in .discopop/profiler. Output appears in the pane on the right.
In-place execution together with applied suggestions modifies your project directory. The GUI asks for confirmation.
Results are stored in .discopop/project/execution_results.json.
Report
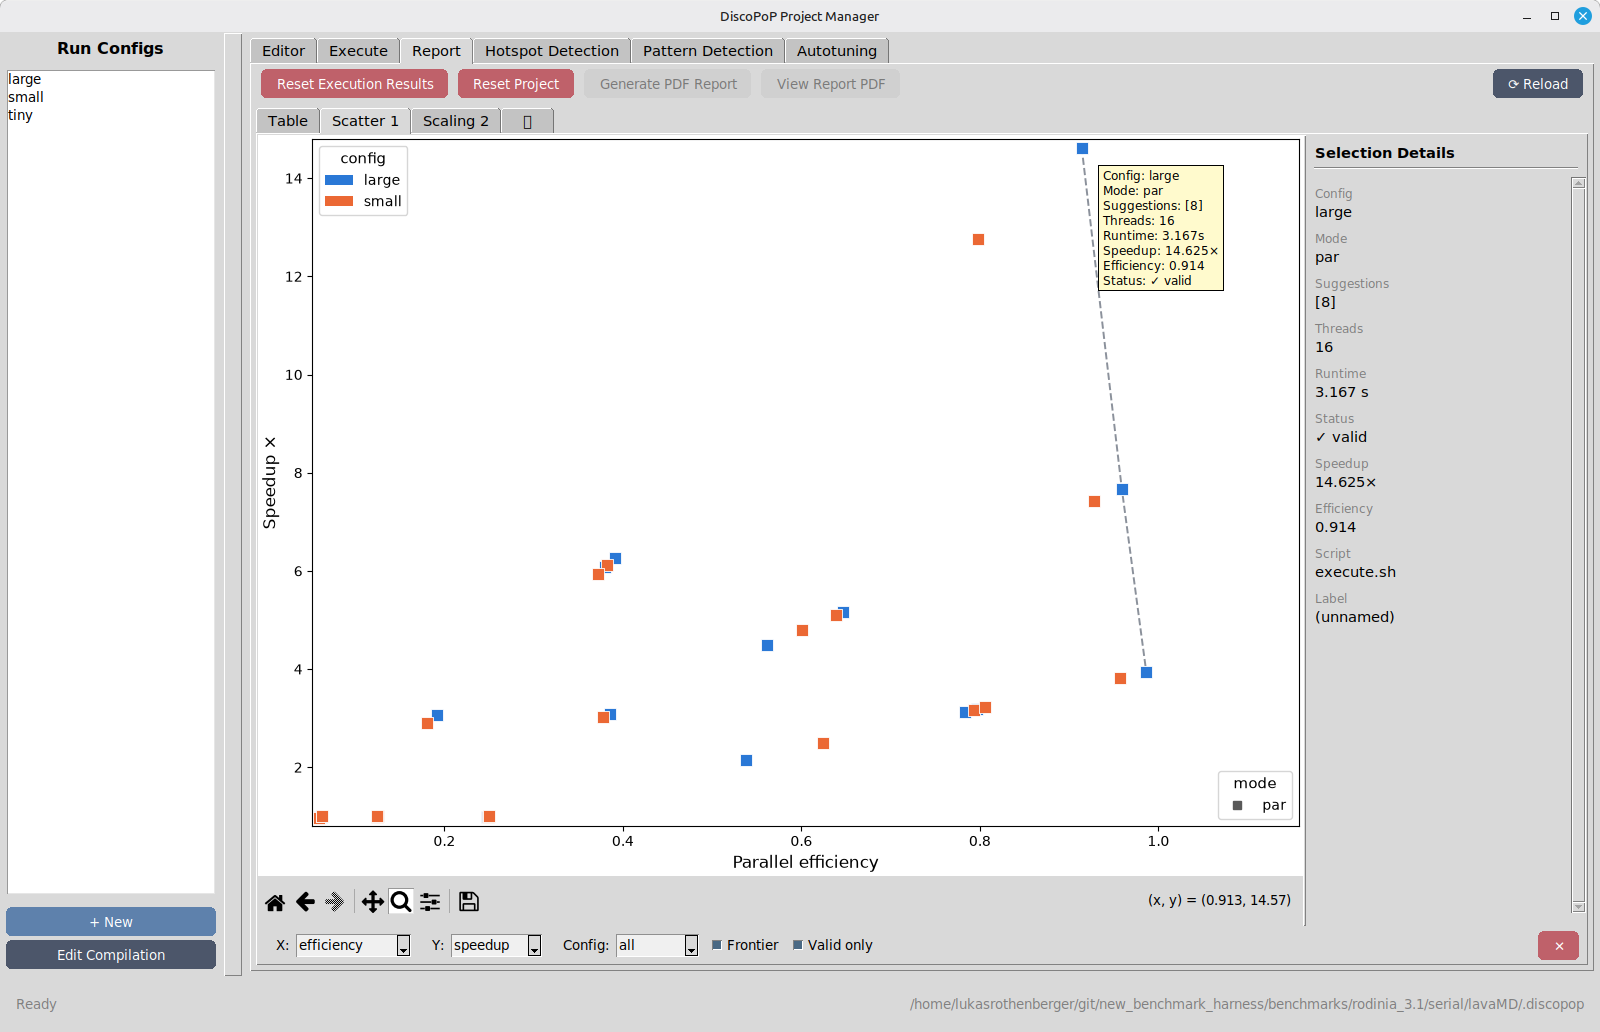
The Report tab shows all recorded measurements. The Table tab lists configuration, script, setting, label, applied and not applied suggestions, threads, status, time, speedup and efficiency; speedup is relative to the seq run of the same script. With the + tab you add plots: Trade-off scatter, Thread scaling, Speedup / efficiency bars and Runtime bars. Click a point or bar to see its details.
- Generate PDF Report and View Report PDF create and open
.discopop/project/reports/<timestamp>/full_report.pdf(the folder also holdsreport.csvand single PDFs). Viewing usesxdg-open. - Reset Execution Results deletes the measurements and reports. Reset Project deletes everything below
.discopopexcept the configurations. Both ask for confirmation. - Reload re-reads the results.
Hotspot Detection
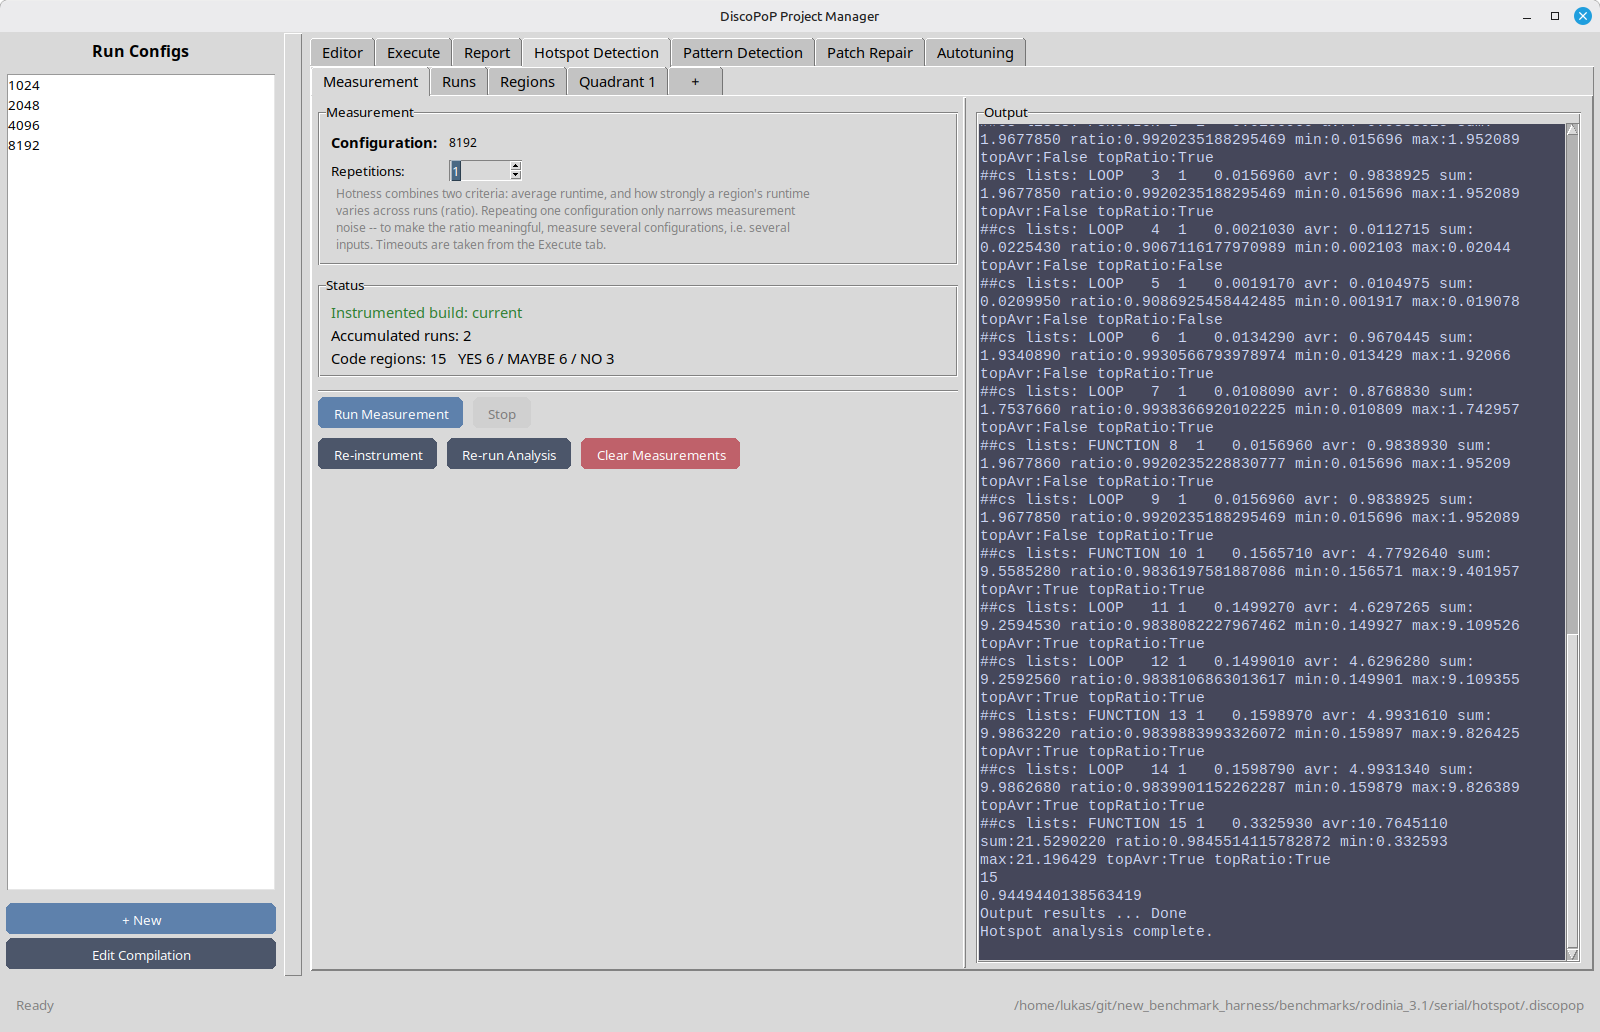
The tab measures which loops and functions dominate the runtime. See Hotspot detection for the method. It has the sub-tabs Measurement, Runs, Regions and plot tabs added with + (Hotness quadrant, Top-N runtime bars, Per-region run profile).
Measurement runs the selected configuration in hd mode in place: it builds the program with discopop_hotspot_cc/discopop_hotspot_cxx (if the build is missing or outdated), executes it Repetitions times and calls discopop_hotspot_analyzer on all accumulated runs. Repeating one configuration only reduces noise. To make the hotness classification meaningful, measure several configurations with different input sizes; the runs of all configurations are combined.
| Button | Effect |
|---|---|
| Run Measurement / Stop | Instrument if necessary, execute, analyze |
| Re-instrument | Build the hotspot-instrumented program again |
| Re-run Analysis | Run the analyzer again on the accumulated runs |
| Clear Measurements | Delete the accumulated runs |
Runs lists every recorded run (runs recorded elsewhere, for example in the Execute tab, by the command line or by the MCP server, are marked (external)). Regions lists the code regions with hotness (YES, MAYBE, NO), kind, location, average, share, minimum, maximum, ratio and number of runs, with filters for hotness and kind.
Results are stored in .discopop/hotspot_detection/ (Hotspots.json and the run log measurement_runs.json).
Pattern Detection
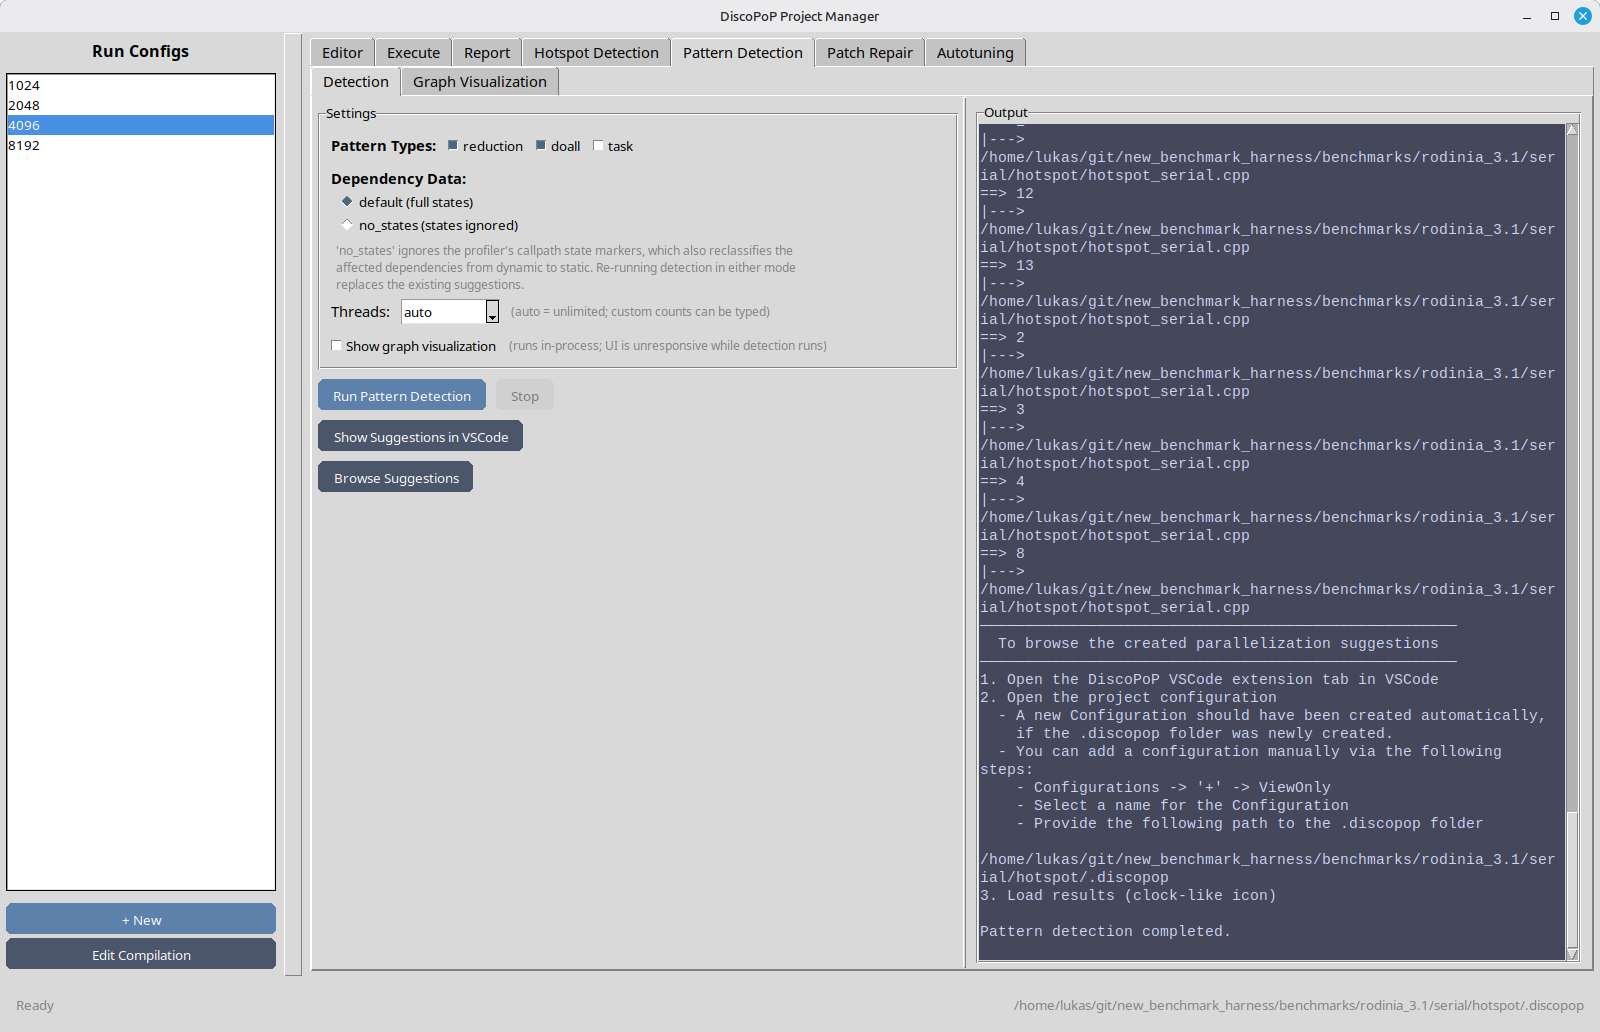
The tab runs discopop_explorer in the .discopop directory. It needs the profiling data of a dp run (use Prepare Pattern Detection in the Execute tab first).
| Setting | Meaning |
|---|---|
| Pattern Types | reduction and doall (default); task is experimental |
| Dependency Data | default (full states) or no_states (states ignored), i.e. --ignore-dependency-states |
| Threads | Worker processes of the Explorer (-j); auto = unlimited |
| Show graph visualization | Runs the Explorer inside the GUI process and shows its graphs in the Graph Visualization tab. The window is unresponsive while it runs. |
If no hotspot results exist, a hint offers to go to the Hotspot Detection tab: the Explorer restricts its analysis to the hot parts of the program when Hotspots.json exists.
Buttons: Run Pattern Detection, Stop, Browse Suggestions and Show Suggestions in VSCode. Browse Suggestions lists the suggestions and shows and edits their patch files in .discopop/patch_generator/. Show Suggestions in VSCode opens the project in VS Code (the code command must be on your PATH); see below.
Results are the files described in Explorer: explorer/patterns.json and the patches in patch_generator/.
Patch Repair
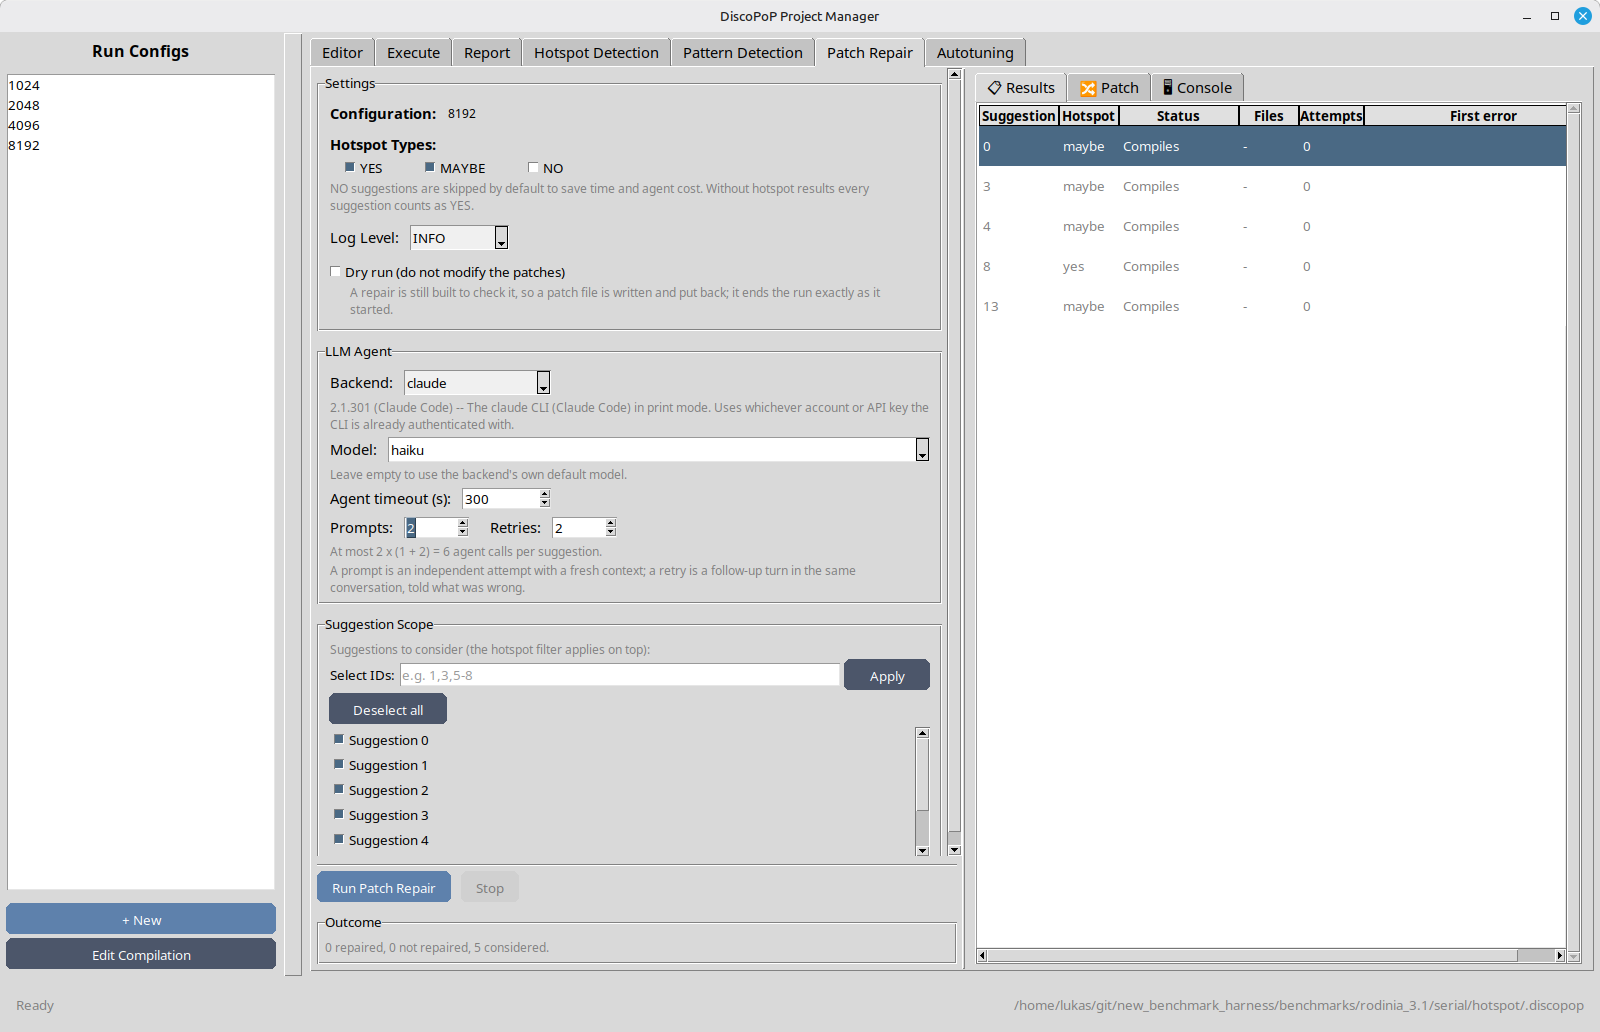
The tab runs discopop_patch_repair: an LLM agent repairs generated patches that do not compile. Settings are the hotspot types (NO is off by default), log level, Dry run, the LLM backend and model, the agent timeout, the number of prompts and retries, and the suggestions to consider. The right side shows Results, the repaired Patch as a diff and the Console.
Autotuning
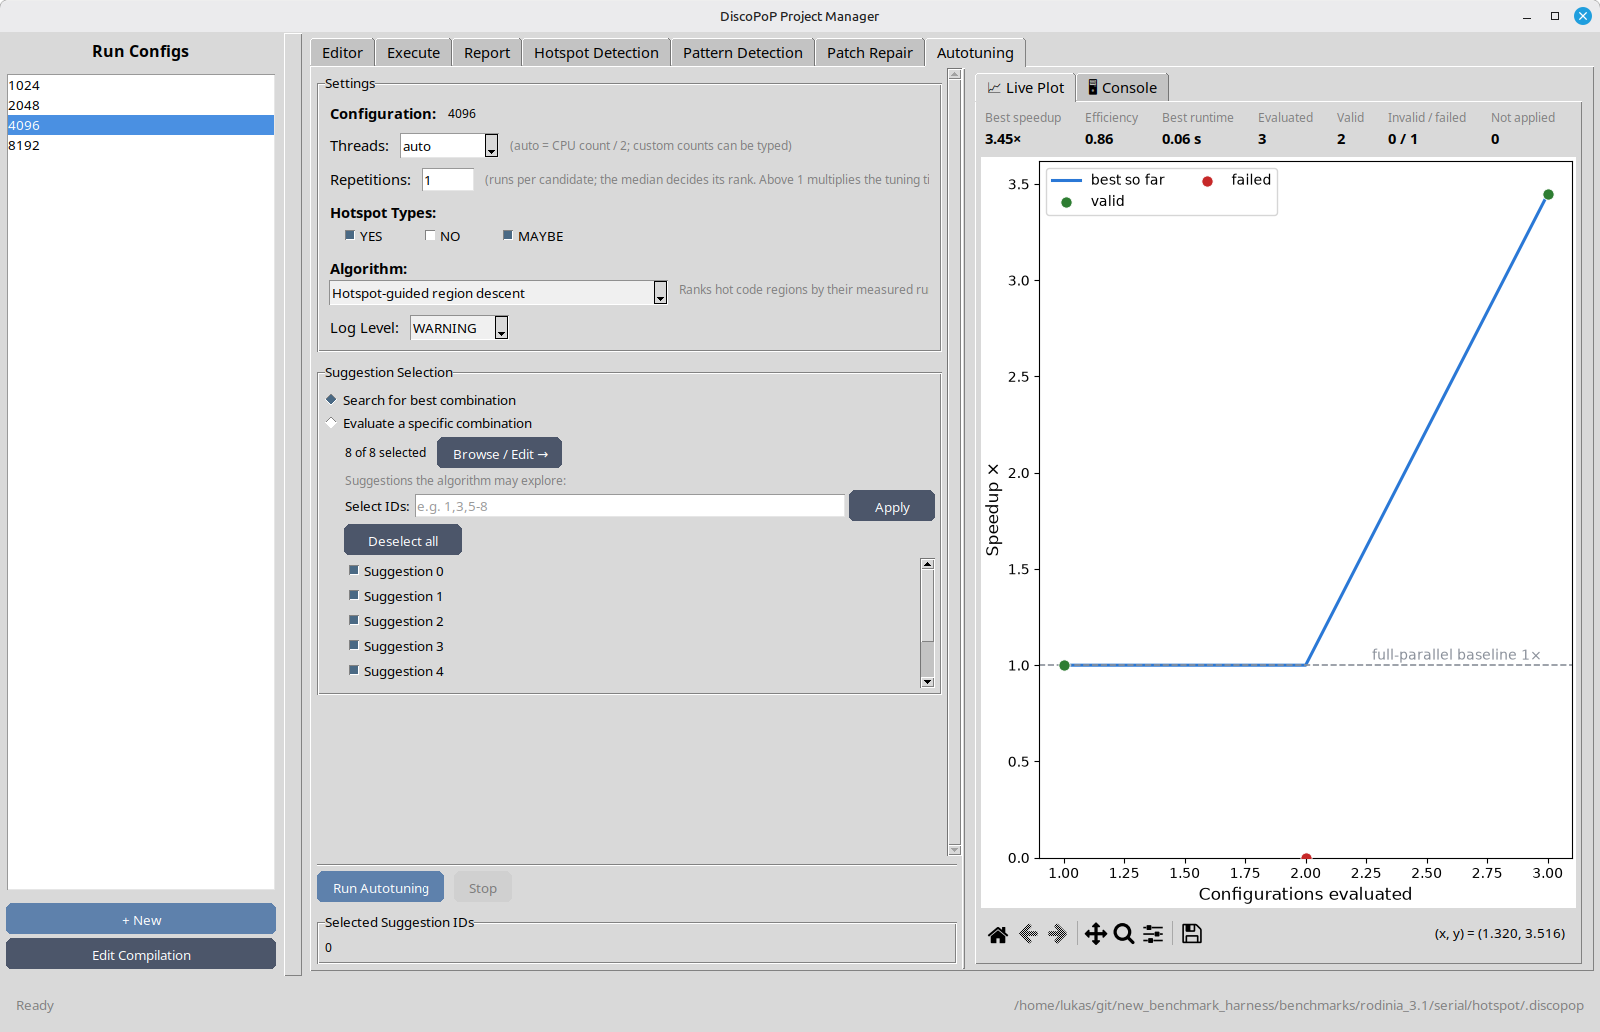
The tab runs discopop_auto_tuner for the selected configuration. It needs the output of pattern detection and the dp and hd settings.
| Setting | Meaning |
|---|---|
| Threads | OMP_NUM_THREADS of the measurements (auto = CPU count / 2) |
| Repetitions | Runs per candidate (default 1) |
| Hotspot Types | YES (default), NO, MAYBE |
| Algorithm | 0 to 6; the GUI preselects 6, Hotspot-guided region descent, which needs hotspot results (the tab warns if they are missing). The command line default is 0. |
| Suggestion Selection | Search for best combination (optionally restricted to a subset) or Evaluate a specific combination |
The Live Plot tab shows every measured configuration while the tuner runs, the Console tab its output. The tab does not apply the result: in the Execute tab, choose Apply autotuner-selected suggestions and run the par mode, or apply the suggestions to your sources with the patch applicator.
What the tabs run
| Tab | Runs |
|---|---|
| Editor, Execute, Report | The code of discopop_project_manager (in the GUI process) |
| Hotspot Detection | The hd mode of the project manager, then discopop_hotspot_analyzer |
| Pattern Detection | discopop_explorer (subprocess; in process with graph visualization) |
| Patch Repair | python -m discopop_library.PatchRepair (discopop_patch_repair) as a subprocess |
| Autotuning | python -m discopop_library.EmpiricalAutotuning (discopop_auto_tuner) as a subprocess |
Where results are stored
Everything is stored in the .discopop directory of the project:
| Path | Content |
|---|---|
project/configs/ | Configurations, shared scripts and settings files |
project/execution_results.json, project/reports/ | Measurements and reports |
profiler/ | Profiling data of the dp mode |
hotspot_detection/ | Hotspot runs and Hotspots.json |
explorer/, patch_generator/ | Detected patterns and patches |
auto_tuner/ | Results of the autotuner |
patch_repair/ | Results of patch repair |
Relation to the VS Code extension and the MCP server
- The VS Code extension is an addition to the GUI. It browses (and applies) the suggestions and hotspots inside the editor. Show Suggestions in VSCode opens the project there. The GUI does not need the extension.
- The MCP server uses the same configurations below
.discopop/project. Configurations you created in the GUI can be used by an LLM agent and the other way round.